Student Outcomes
Persistence, Progression, and Completion: A Review of Valencia’s Student Outcomes
Valencia has long held the Big Idea that “Anyone can learn anything under the right conditions.” We believe that setting ambitious goals for student achievement and outcomes orients our institution toward implementing strategies and tactics that support students in pursuit of their goals and creating the conditions that all students need to achieve success.
Additional Resources
2019 Student Outcomes Insight Paper
2018 Student Outcomes Insight Paper
Interactive Dashboard
For a more detailed analysis of student outcomes, visit the Student Indicators interactive Tableau dashboard.
Graduation Rate
Valencia College has considerably higher graduation rates compared to its peers. Figure 1 displays Valencia’s graduation rates and that of our peer institutions matched on student demographics and size as calculated by the Integrated Postsecondary Education Data System (IPEDS). The IPEDS graduation rate is calculated by measuring the percentage of students who enrolled as first-time-in-college (FTIC) students in the Fall term on a full-time (12 credit hours or more) basis. The college in our IPEDS peer comparison group with the highest graduation rate is Foothill College in Los Altos Hills, California, with a graduation rate of 61%.
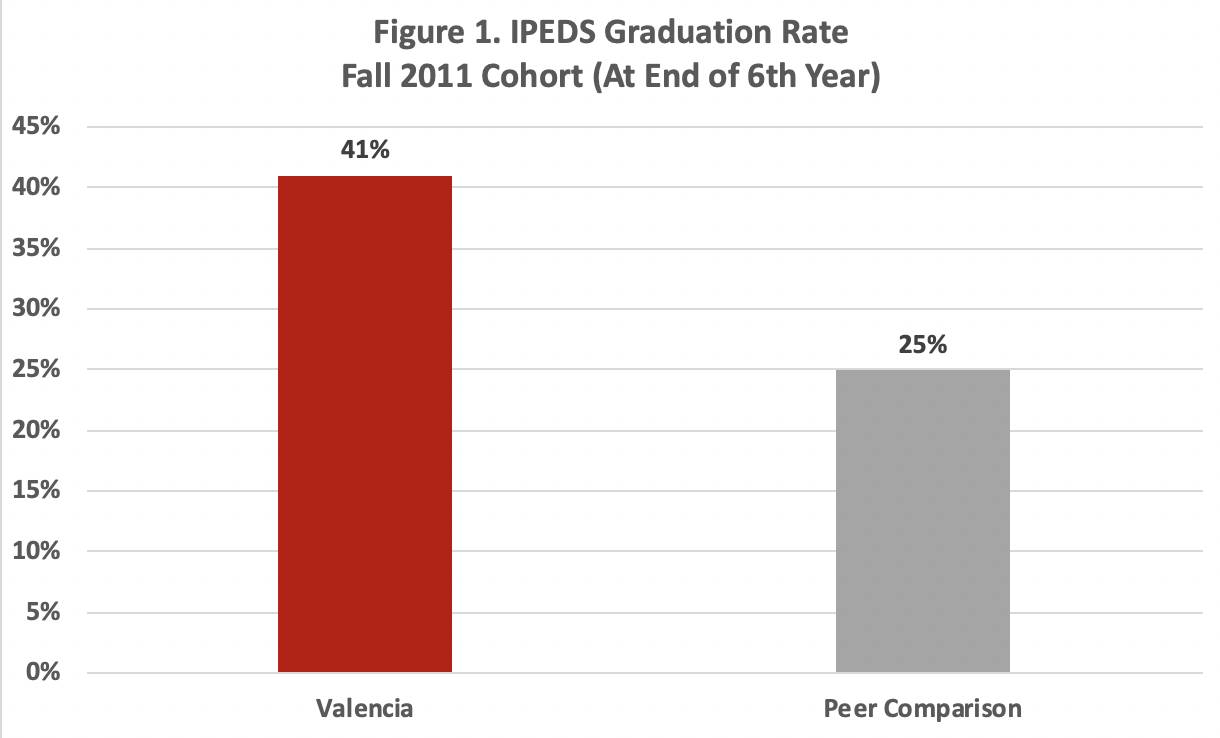
Figure 1. IPEDS Graduation Rate (Fall 2011 Cohort) at End of Sixth Year
Changes in Graduation Rates Over Time
Valencia regularly evaluates its five-year graduation rate which measures the percentage of FTIC, degree-seeking students who first enroll at Valencia in the Fall term (on either a full-time or part-time basis) and who receive their associate’s degree within five years. As is evident in Figure 2, Valencia’s five-year graduation rate has increased over time, from 27.9% for students who first enrolled in Fall 2004 to 33.7% for students who first enrolled in Fall 2014. The five-year graduation rate reached a peak (35.2%) for students who first enrolled in Fall 2008. It has been relatively stable for the three most recent cohorts.
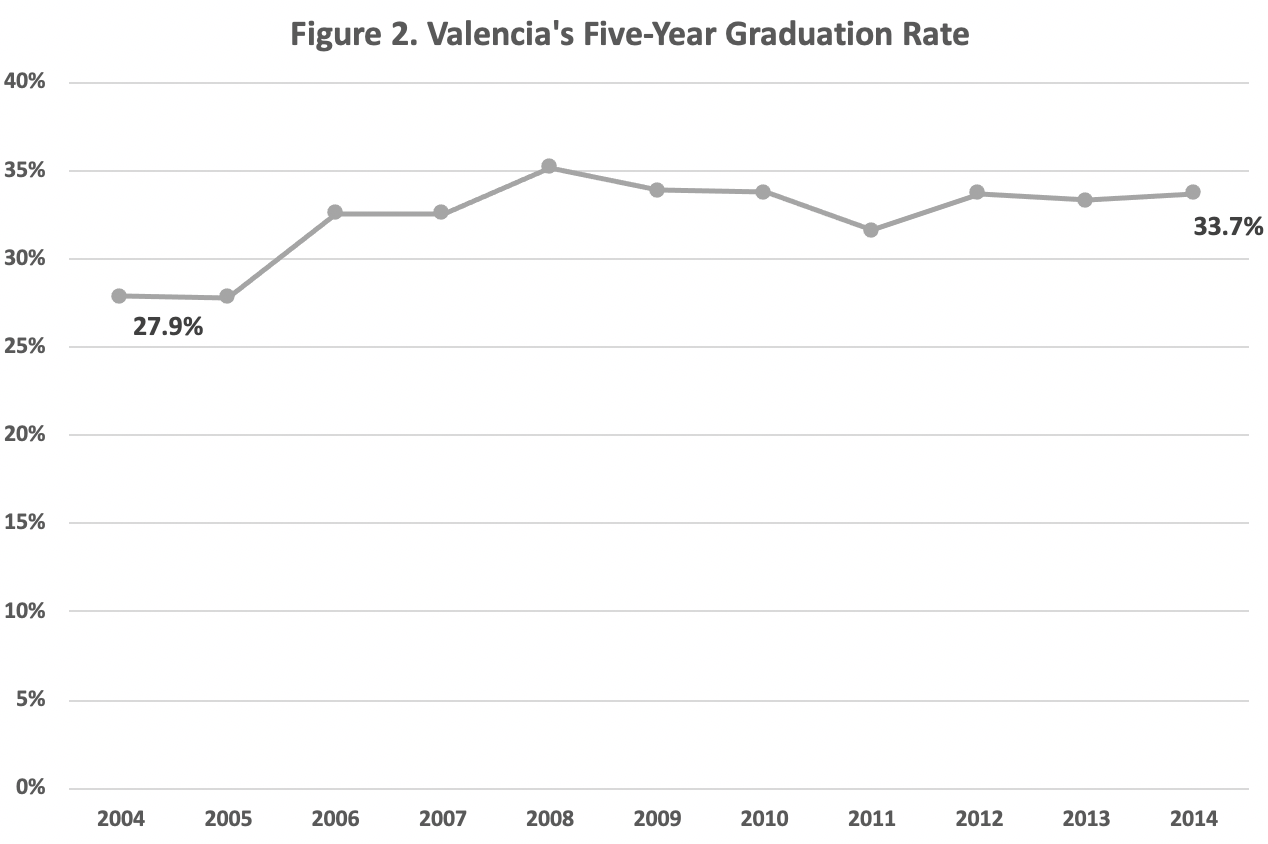
Figure 2. Valencia’s Five-Year Graduation Rate (Fall FTIC Cohorts)
Graduation Rates
An examination of Valencia’s graduation rates disaggregated by race and ethnicity reveal differences across student groups. Our IPEDS 2011 Cohort data reveal that graduation rates of students from each race and ethnicity far surpass those of our peer institutions (Figure 3). However, while the graduation rate for students of each race and ethnicity have increased over the last ten years, significant differences in graduation rates have persisted over time (Figure 4).
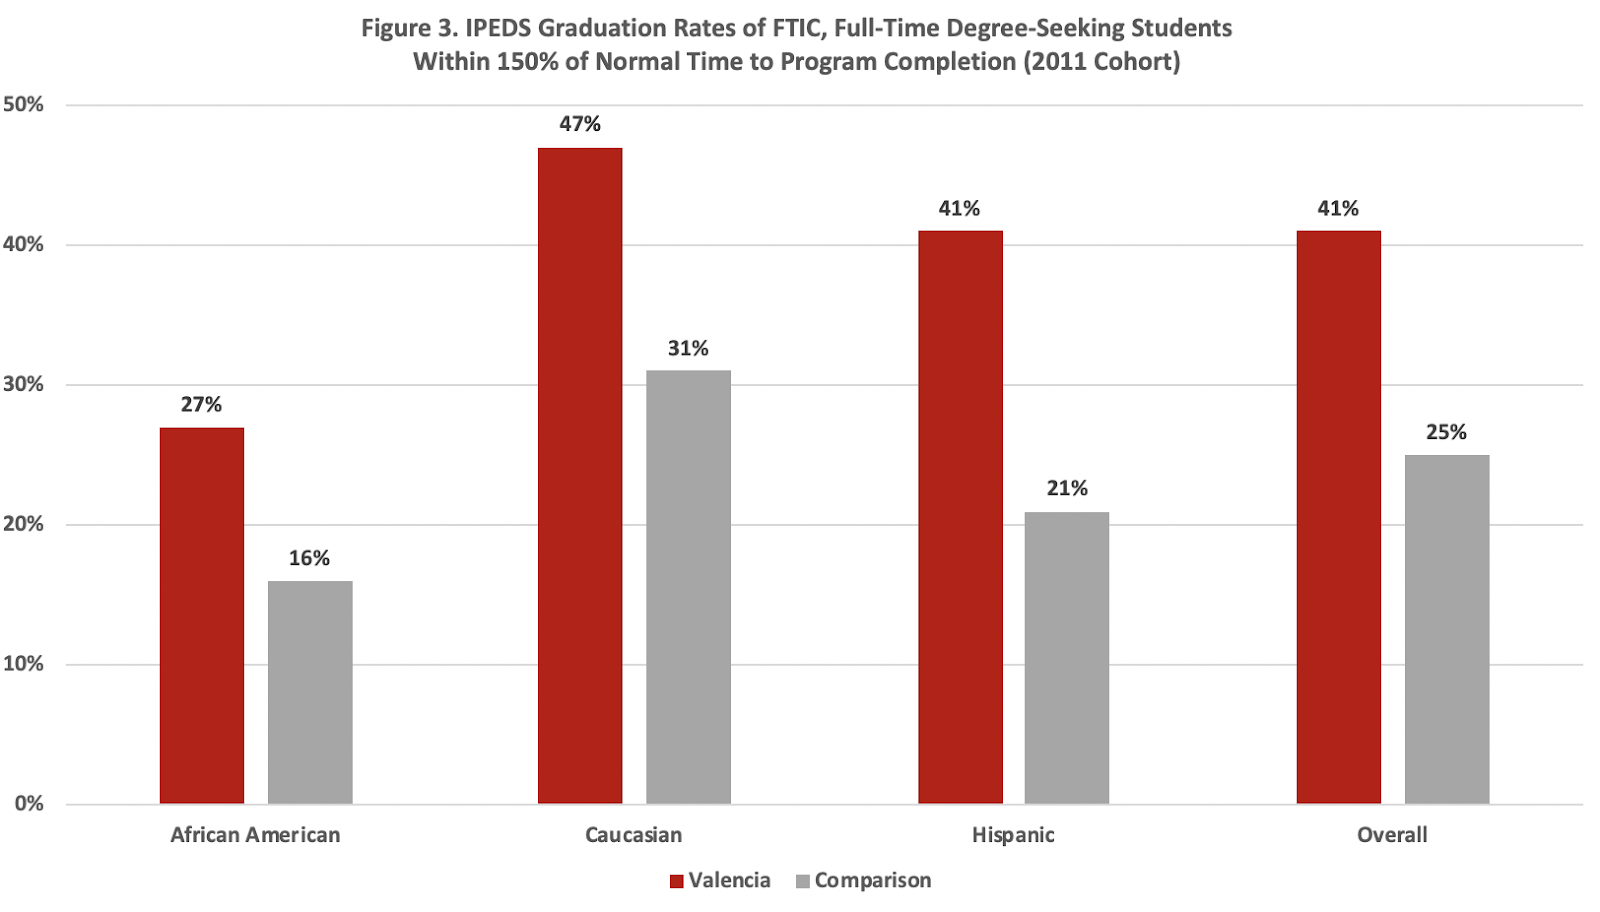
Figure 3. IPEDS Graduation Rate (Fall 2011 Cohort) at End of Sixth Year by Race/Ethnicity
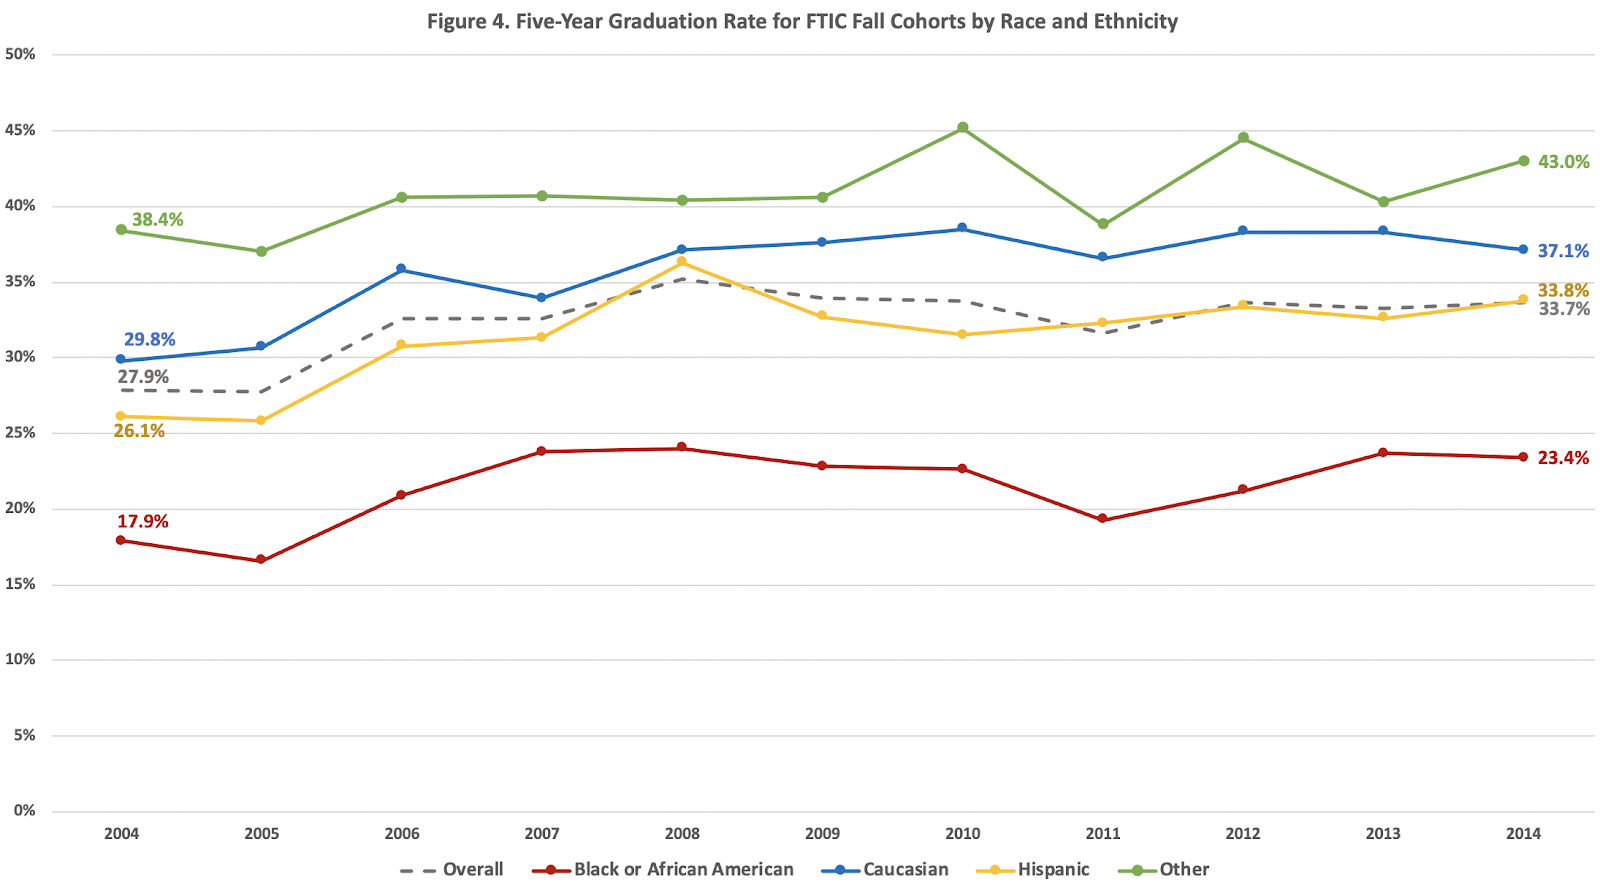
Figure 4. Valencia Five-Year Graduation Rate (Fall FTIC Cohorts) by Race/Ethnicity
As we continue to work on creating the conditions at the college to improve the five-year graduation rate for students of all races and ethnicities, it is important to note that the number of associate degrees awarded overall per incoming cohort has doubled over the last ten years, and the number of associate degrees awarded to Black and Hispanic students has more than tripled over that same timeframe (see Figure 5).
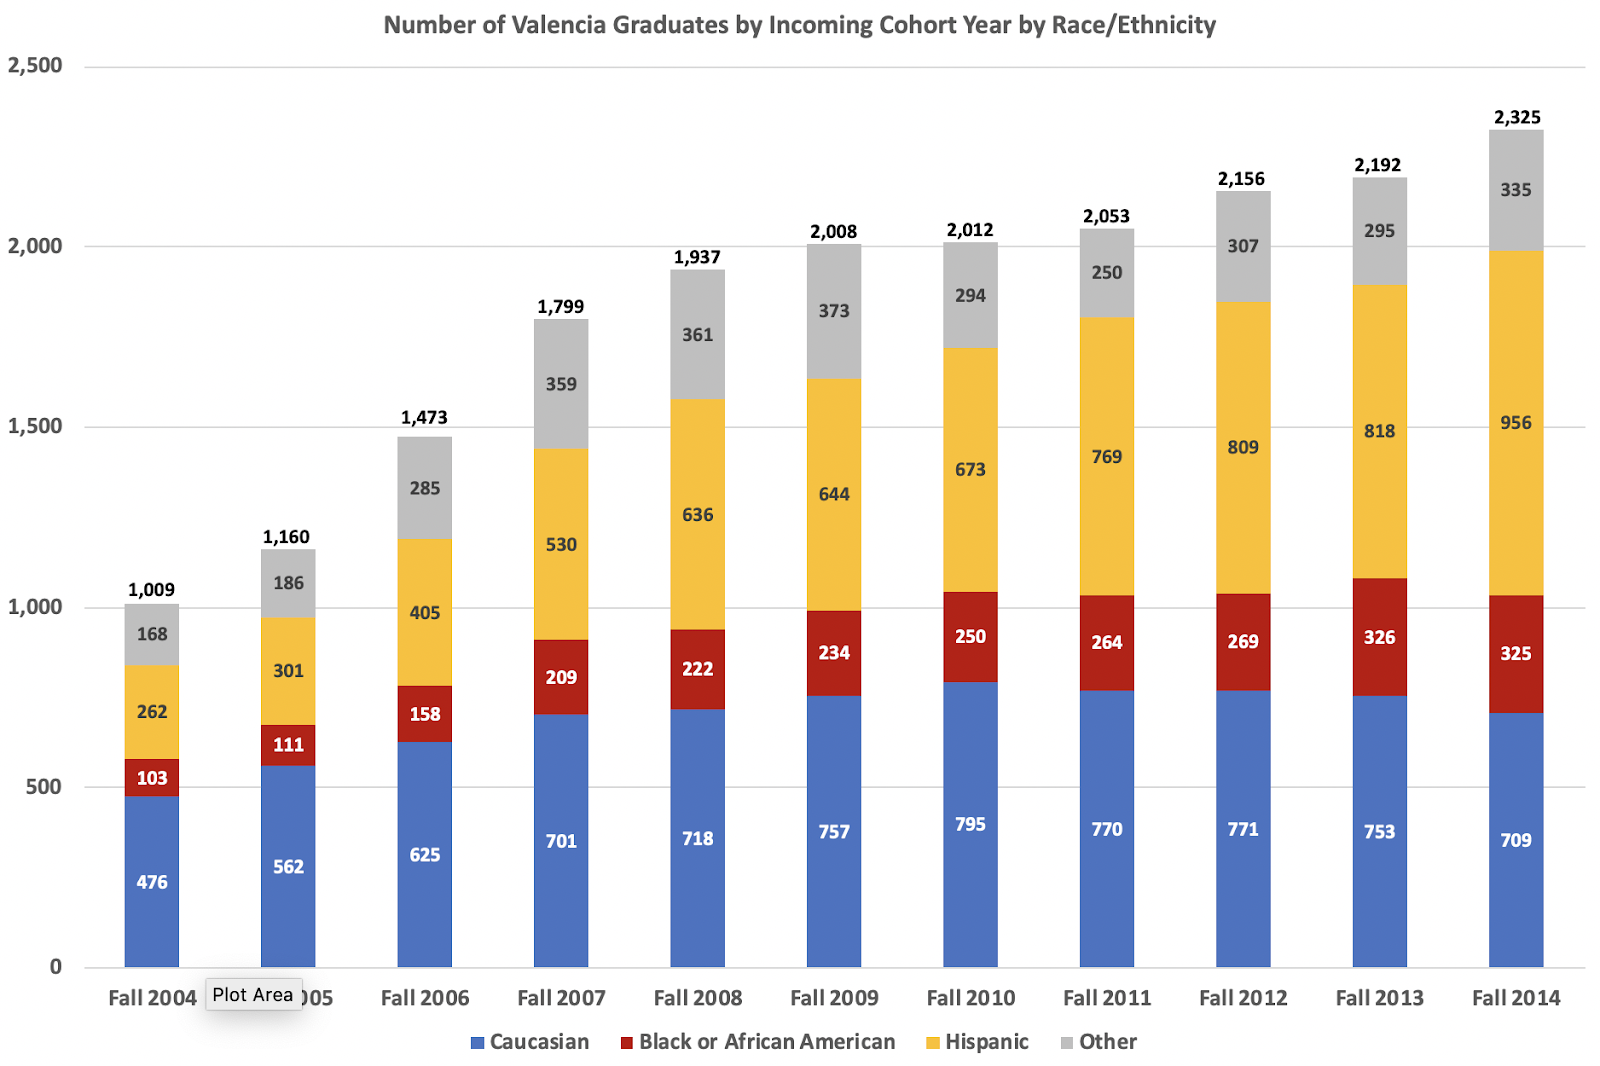
Figure 5. Number of Valencia Graduates by Incoming Cohort Year by Race/Ethnicity
Student Achievement Goals and Outcomes
In 2018, our Faculty Council endorsed the following objectives related to student outcomes:
- The five-year disaggregated graduation rates for first-time-in-college (FTIC), degree-seeking students of each race/ethnicity will exceed 50% so that more than half of all FTIC, degree-seeking students of each race/ethnicity who first enroll at Valencia in the Fall 2025 term will complete an associate degree from Valencia by Summer 2030.
- As a leading indicator of Valencia’s graduation rate, more than 75% of all FTIC, degree-seeking students who first enroll at Valencia in Fall 2021 will earn at least 15 college-level credit hours by Summer 2023.
- As a leading indicator of Valencia’s graduation rate, more than 50% of all FTIC, degree-seeking students who first enroll at Valencia in Fall 2023 will earn all attempted credit hours in their first five courses at Valencia as defined by earning an A, B, or C in each course.
Goals
Goal #1: Graduation Rate
The most recent five-year graduation rate data are from the cohort of students that started at Valencia in Fall 2014 (as the 2019-20 academic year marks five years after they started college). Generally, the graduation rate for Black and African American students has been on an upward trend since the 2011 cohort, while there has been little recent change in the graduation rates for Caucasian and Hispanic students (see Figure 6).
While the change needed to meet our graduation rate goal appears significant, relatively small changes in absolute numbers of students graduating will have a large impact on graduation rates. For example, for the 2014 cohort to have reached our goal of 50% of students completing their goal of earning a degree from Valencia, 369 additional Black or African American graduates, 246 additional Caucasian graduates, and 459 additional Hispanic students would have had to have graduated.
| Graduation Rate | Three-Year Change | From Goal |
|---|---|---|
| Black or African American | + 4.1 percentage points | 26.6 percentage points |
| Caucasian | + 0.5 percentage points | 12.9 percentage points |
| Hispanic | + 1.5 percentage points | 16.2 percentage points |
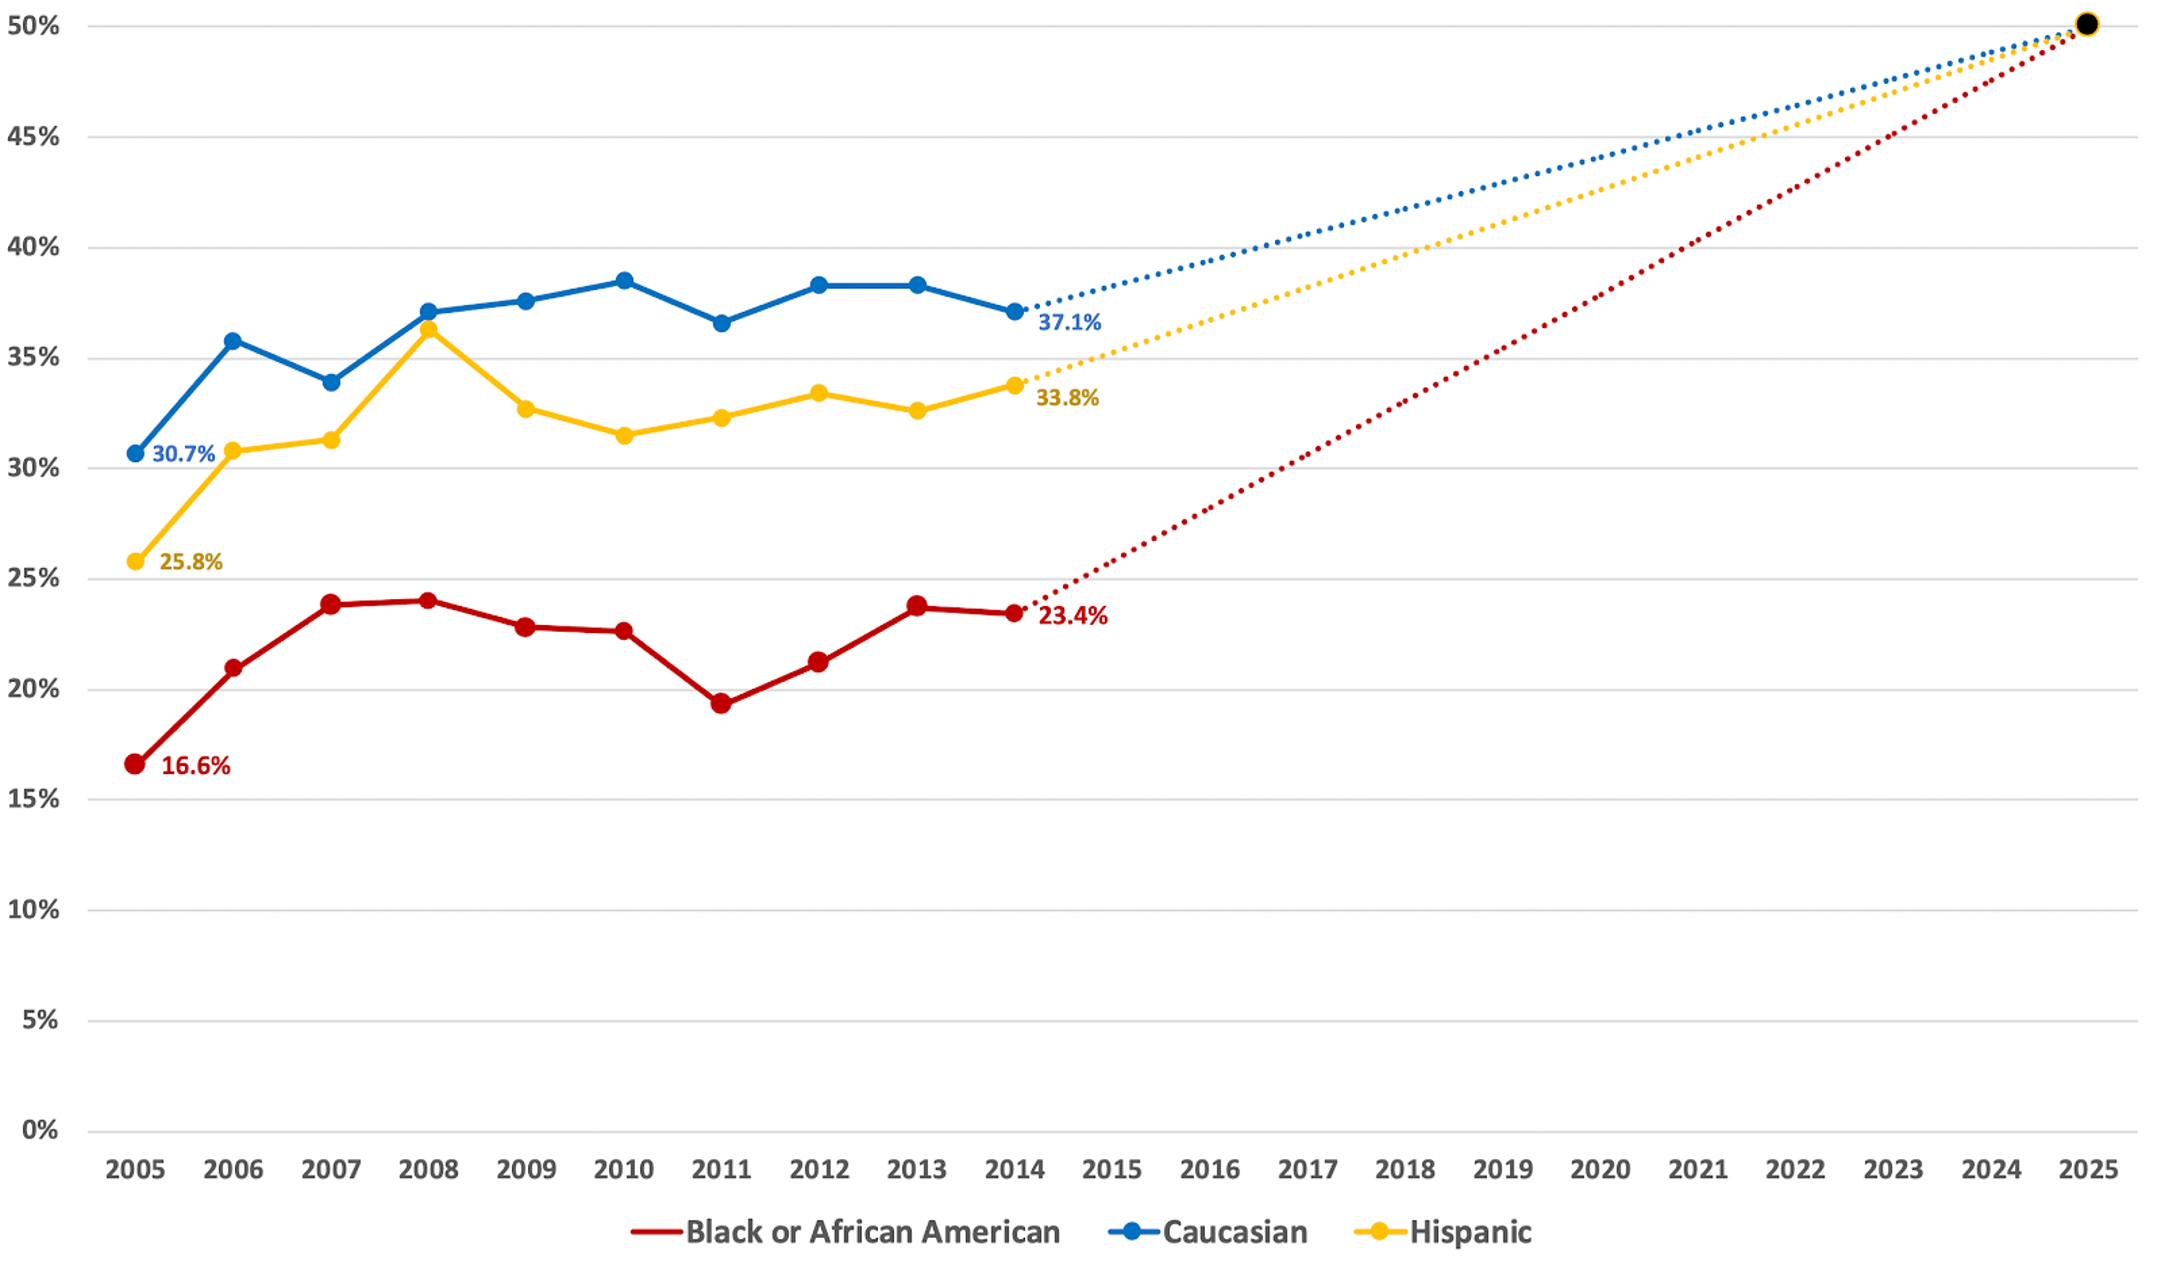
Figure 6. Five-Year Valencia Graduation Rate Goal (by Fall FTIC Cohort)
Goal #2: College-Level Credit Hours
| College-Level Credit Hours | |
|---|---|
| Three-Year Change | + 4.7 percentage points |
| From Goal | 9.1 percentage points |
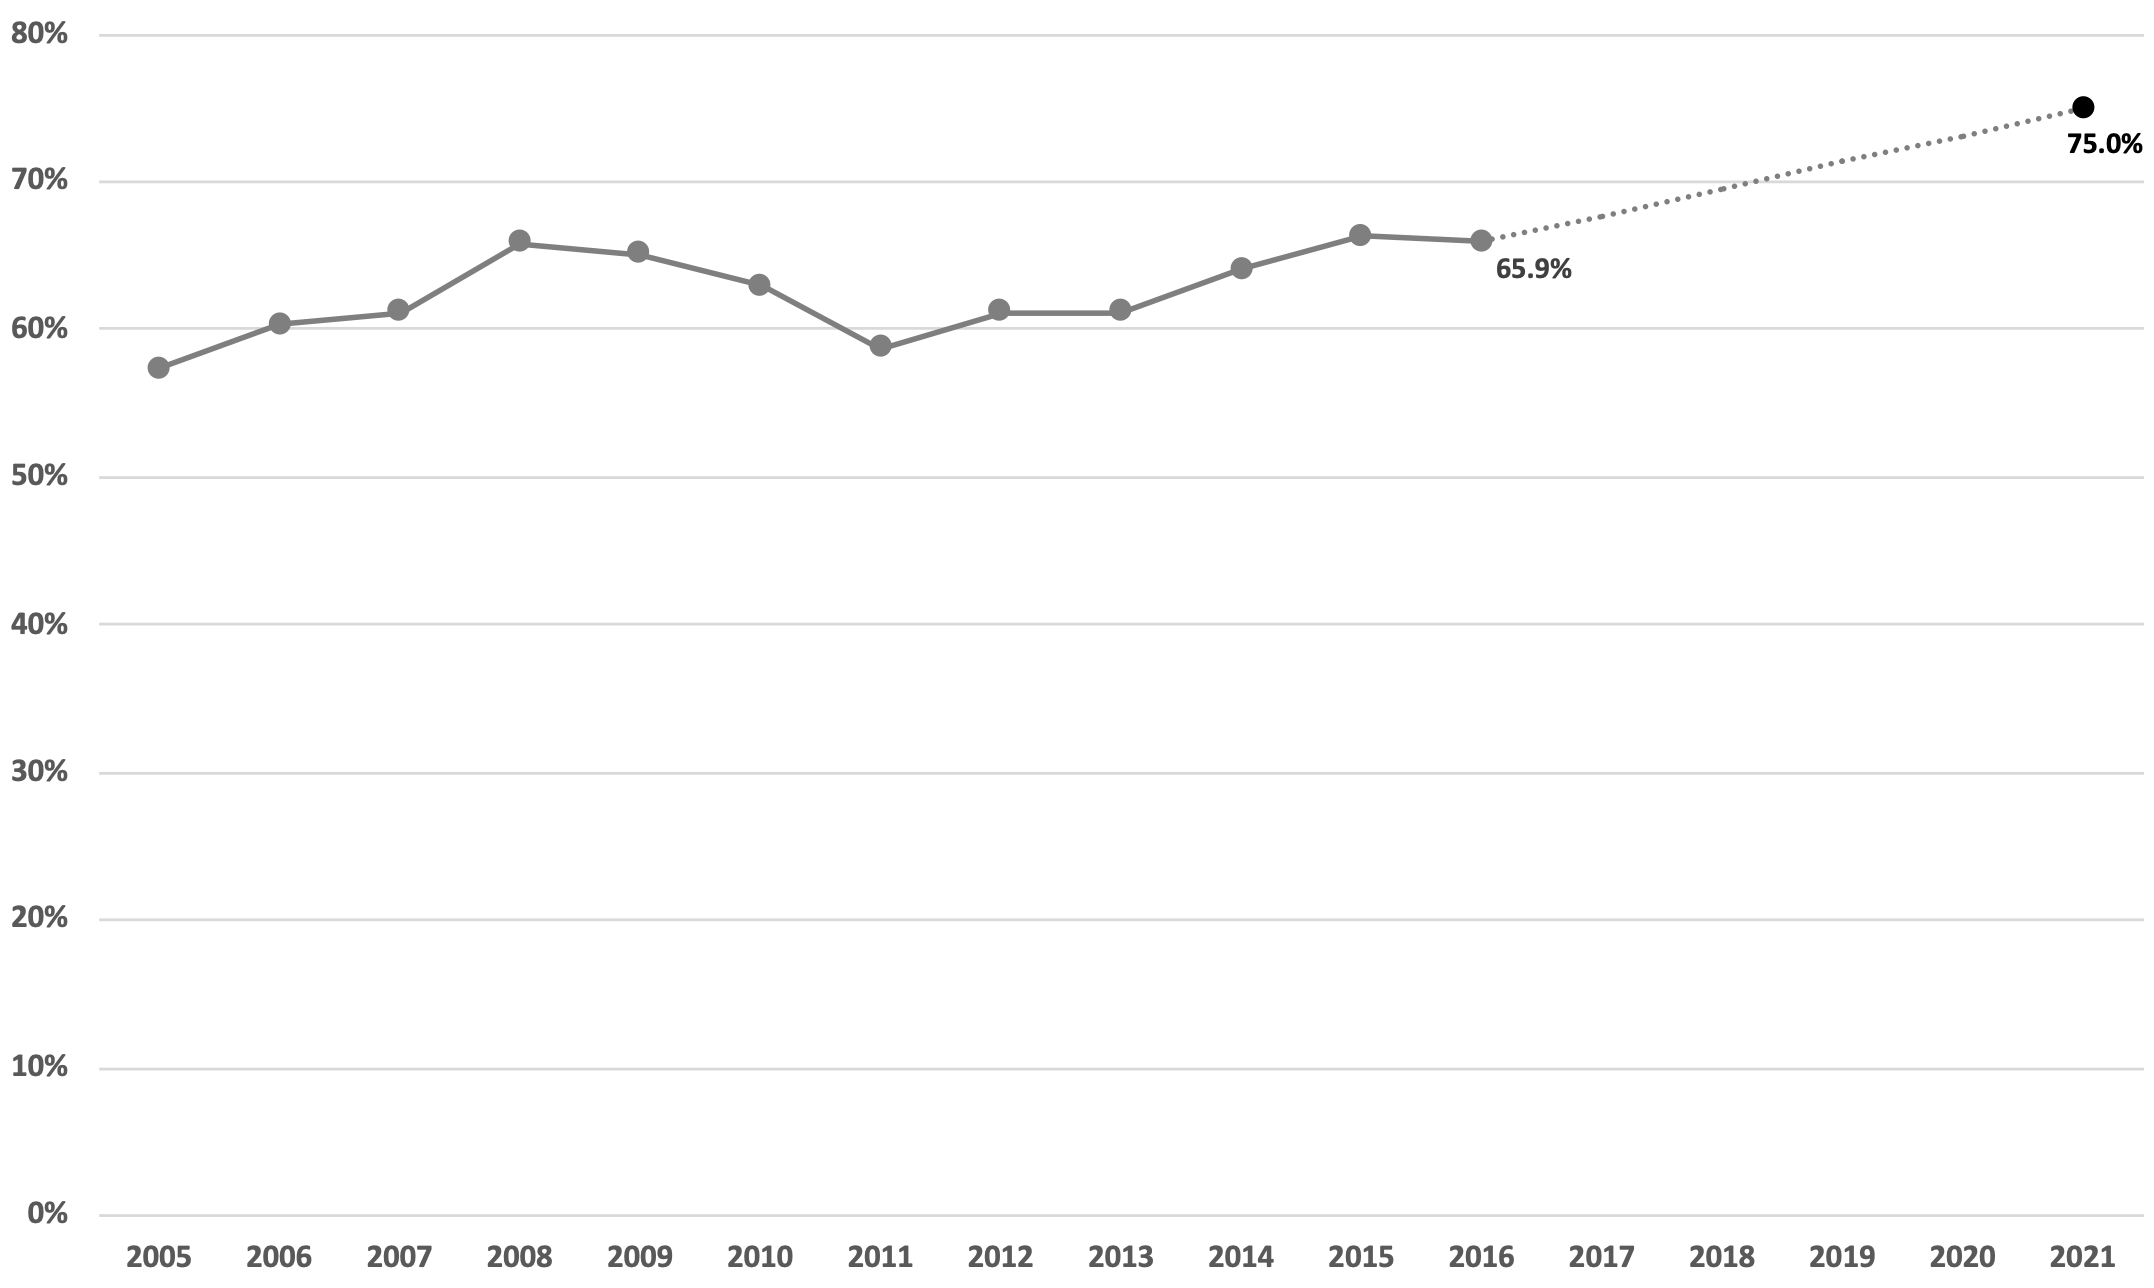
Figure 7. Completion of 15 College-Level Credit Hours Within Two Years (by Fall FTIC Cohort)
Goal #3: Success in First Five
| Success in First Five | |
|---|---|
| Three-Year Change | no change |
| From Goal | 8.8 percentage points |
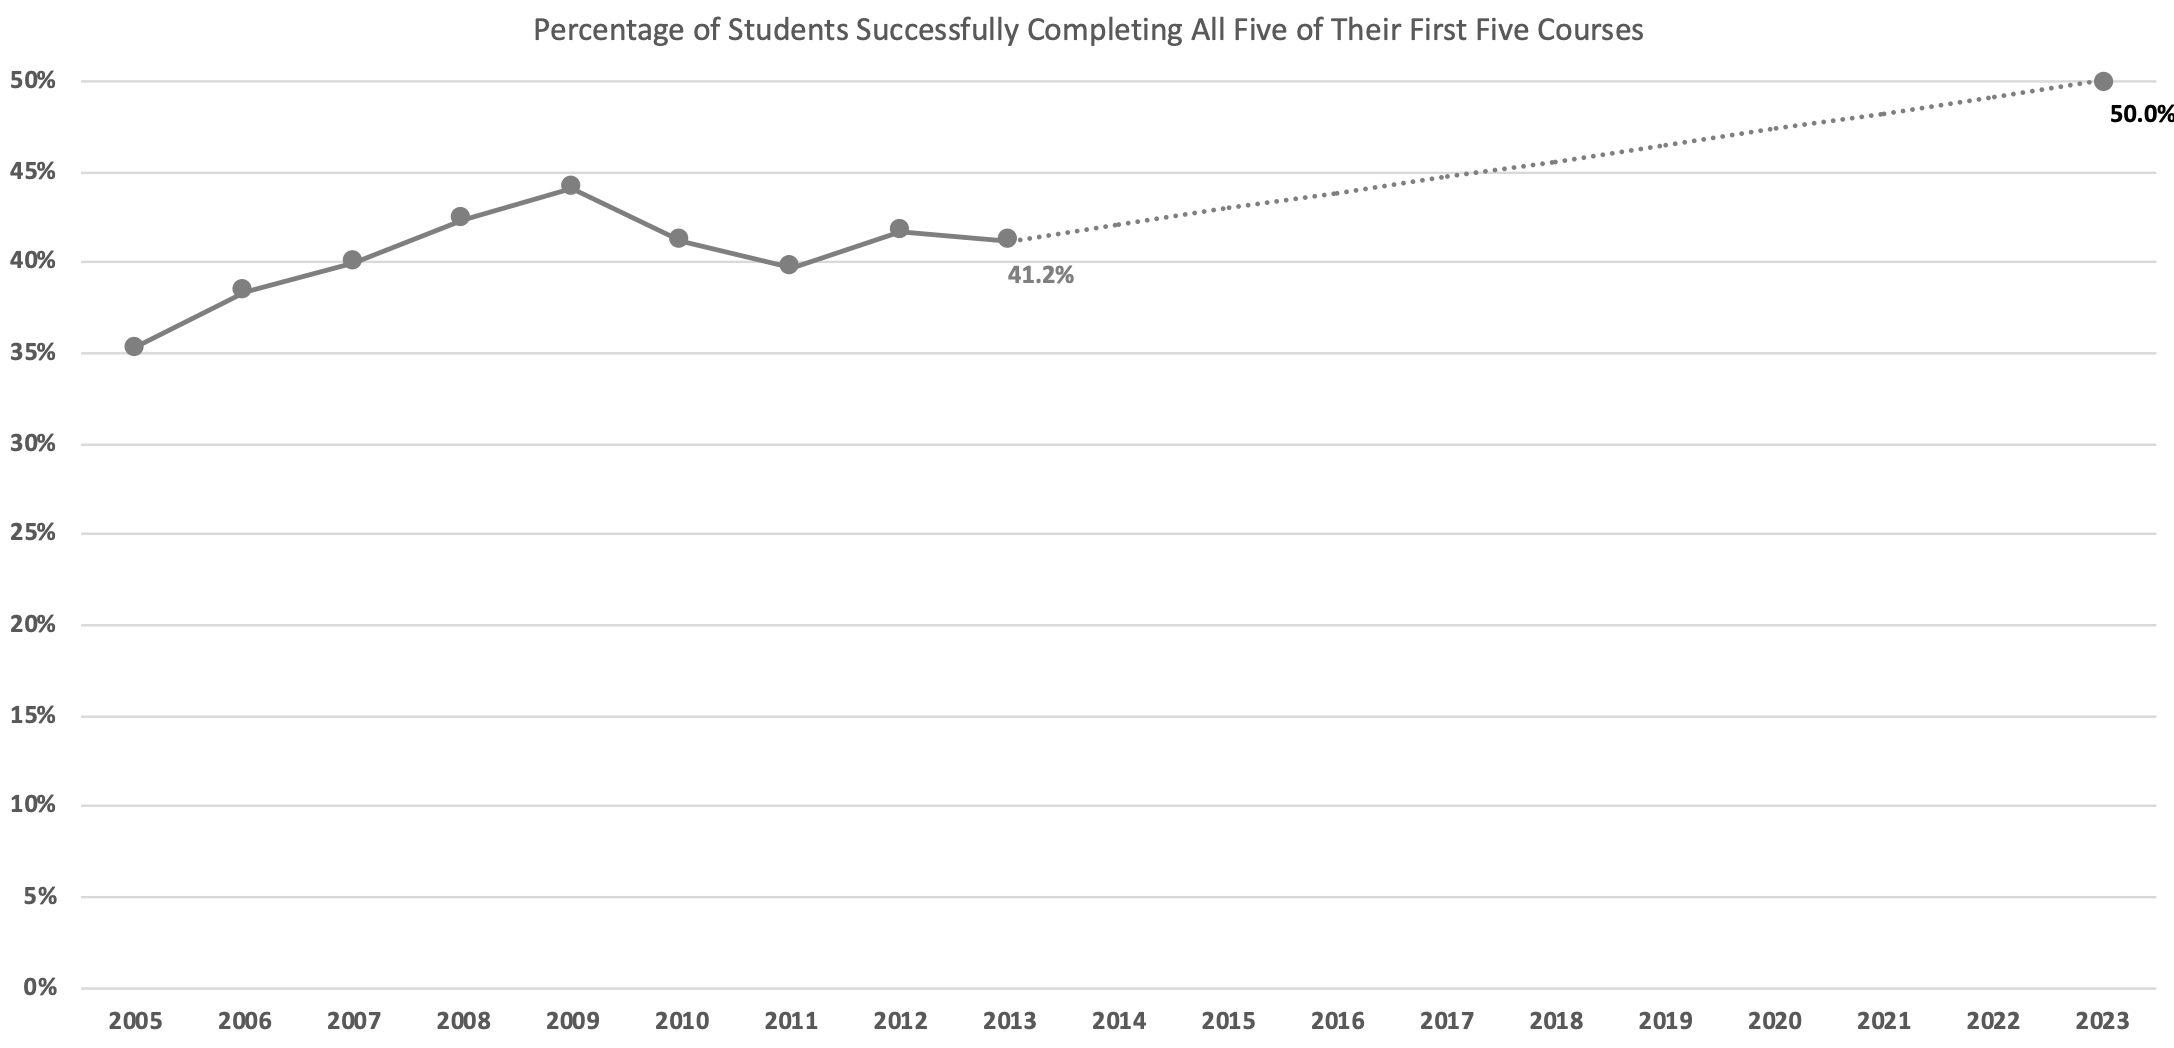
Figure 8. Percentage of Students Completing All Five of Their First Five Cohort (by Fall FTIC Cohort)
Goals #2 and #3 serve as leading indicators for our graduation rate goal. While our most recent data show that more of our students have been completing fifteen college-level credits within two years, fewer students have been successful in all five of their first five course attempts. Given the strong correlation between success in first five and completion, this is a trend to which we should pay close attention. These data also suggest that the development of interventions to support the success of students who have unsuccessful course attempts early in their academic trajectories will be important as we work to raise the graduation rates of all students.