Site Analytics
Please submit a ticket request to get an analytics report for your website. See examples below of the different types of data you can request.
Types of Data
Site Analytics uses reporting to display data about your site or pages. Because these metrics use Google reporting technology, you can find more in-depth explanations of how they are calculated in Google support documentation .
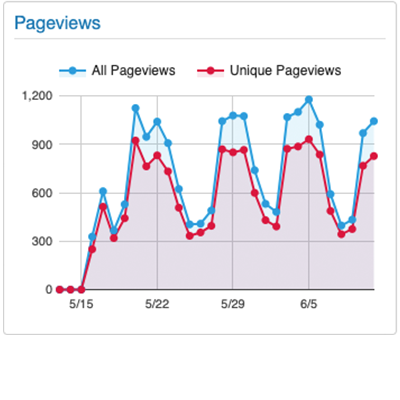
Page Views
Tracks the total number of views your site or page gets over time. Every time the page loads counts as a view; this includes repeated refreshing or going to another page and coming back.
Unique pageviews are also displayed with total pageviews. Only the first time a page is viewed during a browser session counts as a unique view.
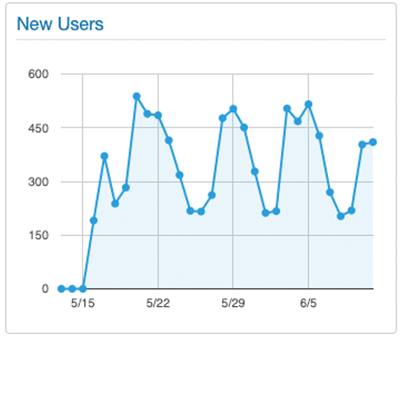
New Users
Tracks the number of people who visit the site or page for the first time over the specified time period.
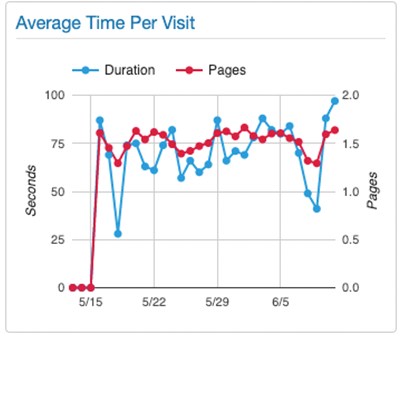
Average Time per Visit
Tracks both the average visit duration in seconds, and the average number of pages viewed, on the same graph.

Bounce Rate and Exit Rate
The bounce rate is the percentage of sessions where a visitor entered the site and then left it without interacting with the page.
The exit rate is determined by how many visitors leave the site from that page, after having interacted with other pages on the site.
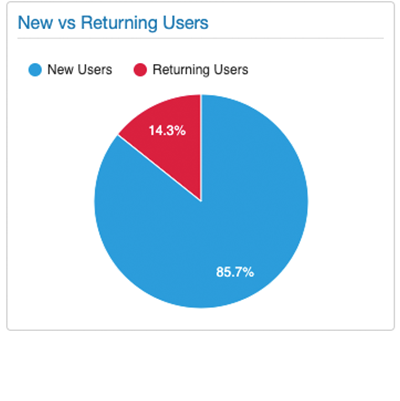
New vs. Returning Users
Compares returning users to new visitors, as determined by cookies. Visits are counted by sessions, not pageviews.
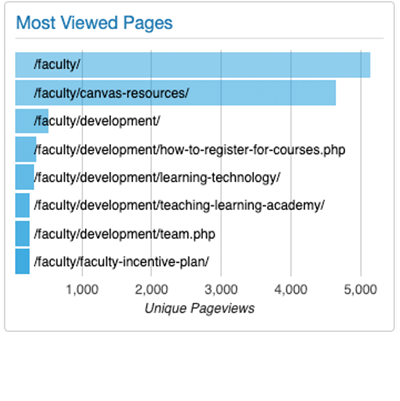
Most Viewed Pages
This is available only in Site Analytics. It shows the pages with the most unique pageviews.

Users by Country
A color-coded map shows from which countries in the world people are viewing your website or page

Users by State
A color-coded map shows from which states in the United States of America people are viewing your website or page.
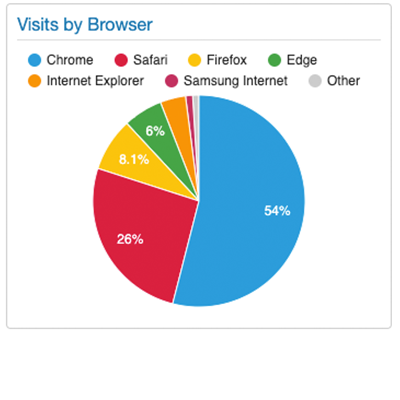
Visits by Browser,OS and ISP
The final three view panels are more for our developers. Data tracked can be used to better understand which browsers are accessing the Valencia College web site.
Shows the breakdown of which web browsers (Firefox, Chrome, etc.), operating systems (Windows, iOS, etc.) and ISP (internet service provider) people are using to view your website or page. This is counted by number of sessions.