Interactive Facts
- - Interactive
- - Web page
Enrollment

Student Characteristics
A report showing characteristics of students broken out by various categories (updated
at the beginning and end of each term).

High School Feedback
A report that addresses selected performance elements of current dual enrolled students,
previous high school graduates, former Career Pathways students and high school alumni
who have graduated from Valencia College.

High School Market Share
A report of Orange and Osceola previous high school graduates that enrolled at Valencia
College in the Fall term.
Strategic Indicators

Strategic Indicators
A report looking at success, persistence and graduation rates as well as credit measures.
Internal Reports (access required)

Credit Registration
Headcount and FTE compared to last years total; includes a courses worksheet and longitudinal
data. Located in Tableau Cloud.

Application Yield
Characteristics of applied and enrolled students per term with longitudinal and term-by-term
comparison. Located in Tableau Cloud.

Dual Enrollment
A report of dual enrollment student characteristics broken out by campus, location
and modality; includes a grade report with credit and course data. Located in Tableau
Cloud.

Degrees Confirmed
A report showing the number of applied and awarded degrees/certificates (with demographics)
by term and academic year. Located in Tableau Cloud.

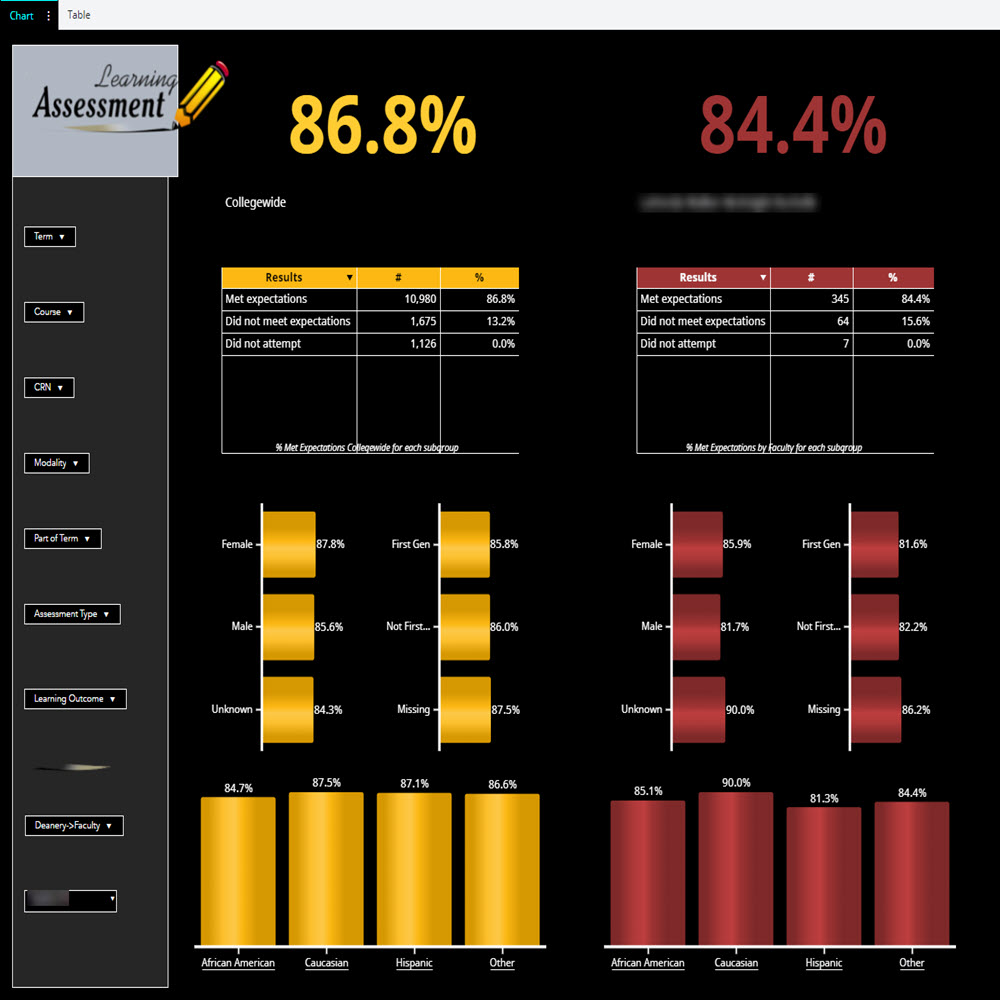
Learning Assessment
Assessment Data from Canvas Outcomes used by Assessment Leadership Teams. Each Canvas
Outcomes is used within an assessment or improvement plan. Faculty who participated
in the plans can see their data compared to the collegewide measures for that Canvas
Outcome. Located in Microsoft Power BI.

Grade Distribution
A report of course enrollment/grades and success rates per term with filters that
allow you to disaggregate the data by student or course attributes. Located in SharePoint.

Subsequent Courses
A comparison report of overall course success and course success after taking a selected
course prior. Located in SharePoint.

Annual Course Review
Course success by student demographics, faculty/modality and course indicators. Includes
an area for action items and implementation strategies. Located in SharePoint.
Reports


International
A summary of SEVIS/NON-SEVIS international student characteristics by country of origin.

Fact Sheet
A summary of college facts, enrollment, average class size, demographics, tuition,
financial aid, degree programs and success rates.


Report Search
A comprehensive list of reports available in the Data Warehouse or SAS Visual Analytics
(documentation included)
